Commonly Asked Questions
What does the Cardinal Analytics Excel Add-In do?
Cardinal Analytics Excel Add-In provides convenience functions for importing Cardinal Analytics proprietary machine learning AI broadly syndicated loan downgrade predictions into Excel. The predictions can be used for many purposes such as monitoring credit risk in existing CLOs and building new CLOs.
How do I install the Add-In?
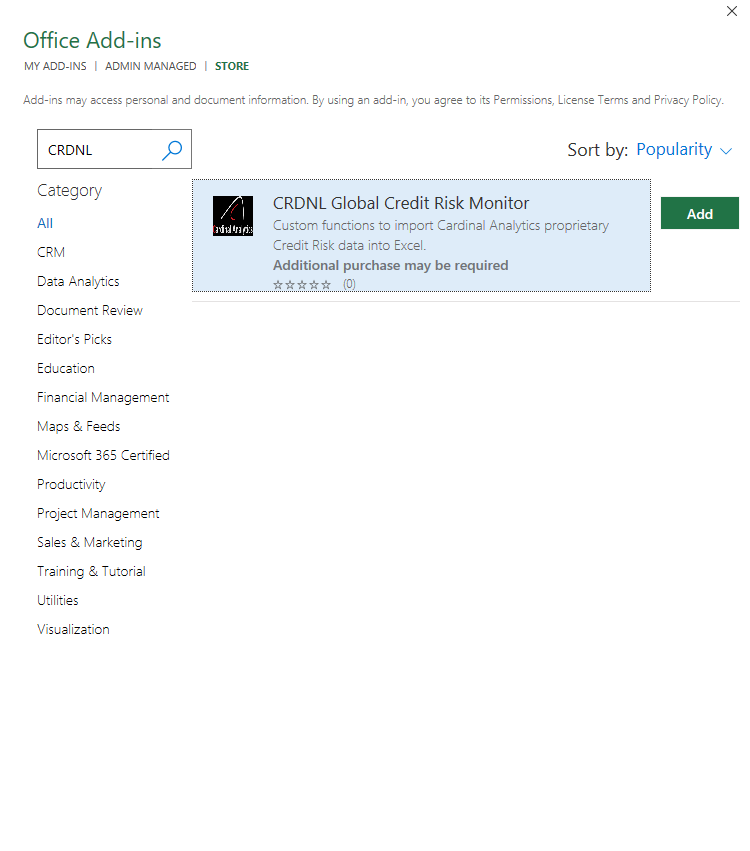
The Add-In can be installed from the Excel Add-In store. Simply click on 'Home', then 'Add-ins' and then 'Get Add-ins'.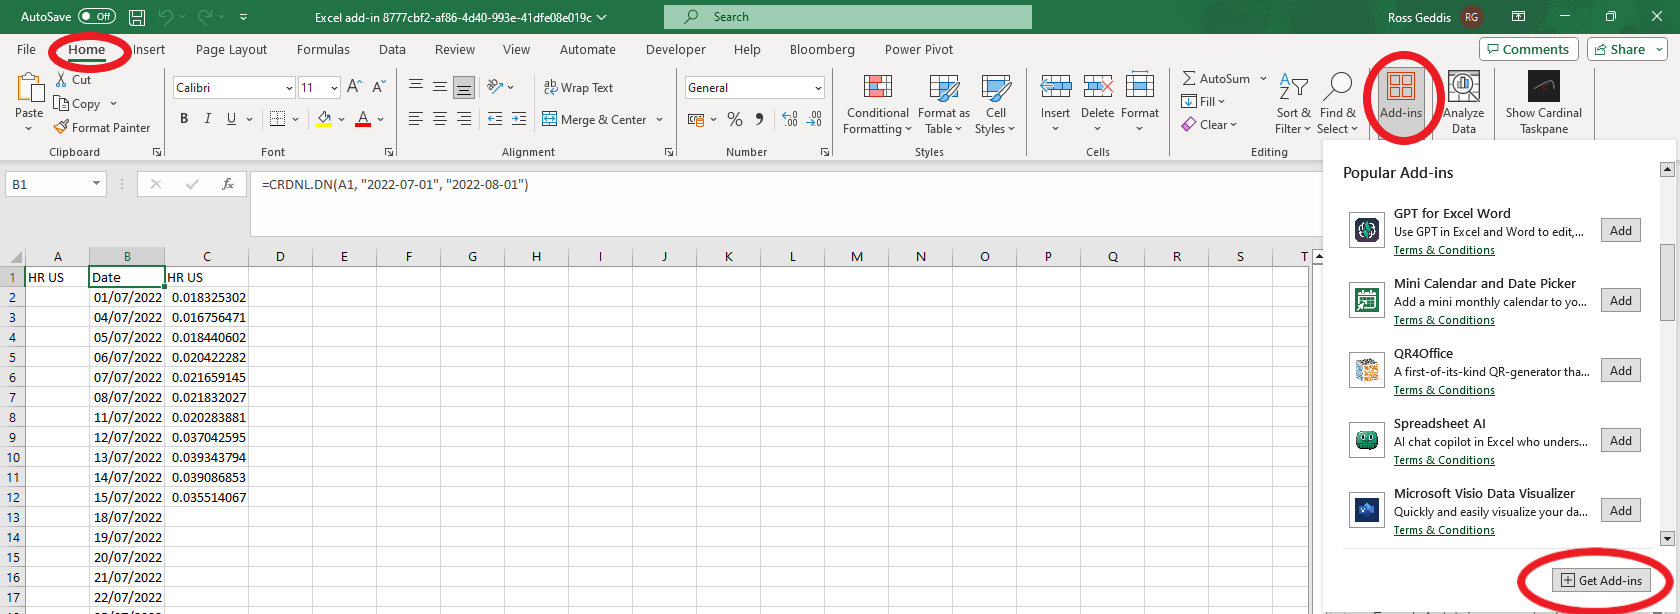 Searching "CRDNL" will then bring up the correct Add-In.
What symbology do you use?
Bloomberg company ticker is currently the only supported symbol. Further symoblogies will be supported in the future.
How do you identify companies?
Companies are identified by their Bloomberg company ticker e.g. Caesars Entertainment Inc is CZR.
How do I get an API key?
To discuss your options please contact our salesteam.
Can I get a demo?
Of course! A demo can be booked here
Application & Examples
Setting the API key
After installing the Add-In and receiving the API key. Paste the API key into input box on the taskpane and click 'Save'.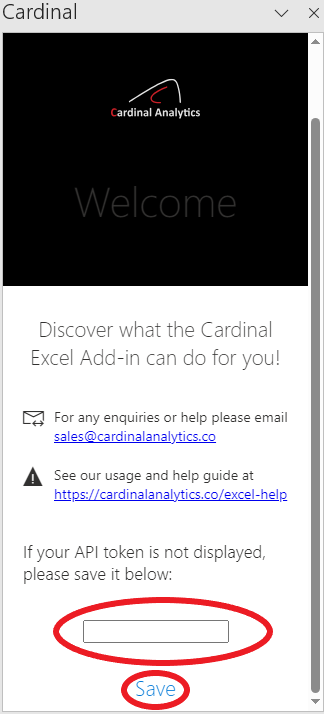
How does it work?
The Cardinal Analytics Excel Add-In functions has three functions: DN - to import downgrade data for a range of tickers and dates = CRDNL.DN(‹cell range›, ‹start_date›, ‹end_date›) where: ‹cell range›: a range of cells containing symbols to search e.g. A1:A10 The ‹start_date› and ‹end_date› parameters are optional, the default behaviour is to fetch the maximum possible range. For example the below fetches downgrade data from 2023-01-01 for a range of tickers. DAT - to import the next available business day's data from a given date
= CRDNL.DAT(‹cell range›, ‹date›, ‹model›) where: ‹cell range›: a range of cells containing symbols to search e.g. A1:A10 The other category is the function to fetch the most recent value. This takes the form: LATEST - to import the most recent business day's data
= CRDNL.LATEST(‹cell range›, ‹model›) Where: ‹cell range›: a range of cells containing symbols to search e.g. A1:A10 The model parameter is optional and defaults to “dn”. The below example shows the Add-In fetching downgrade data for a range of tickers.
‹start_date›: The first date, in the form of YYYY-MM-DD, for which to retrieve data.
‹end_date›: The last date, in the form of YYYY-MM-DD, for which to retrieve data.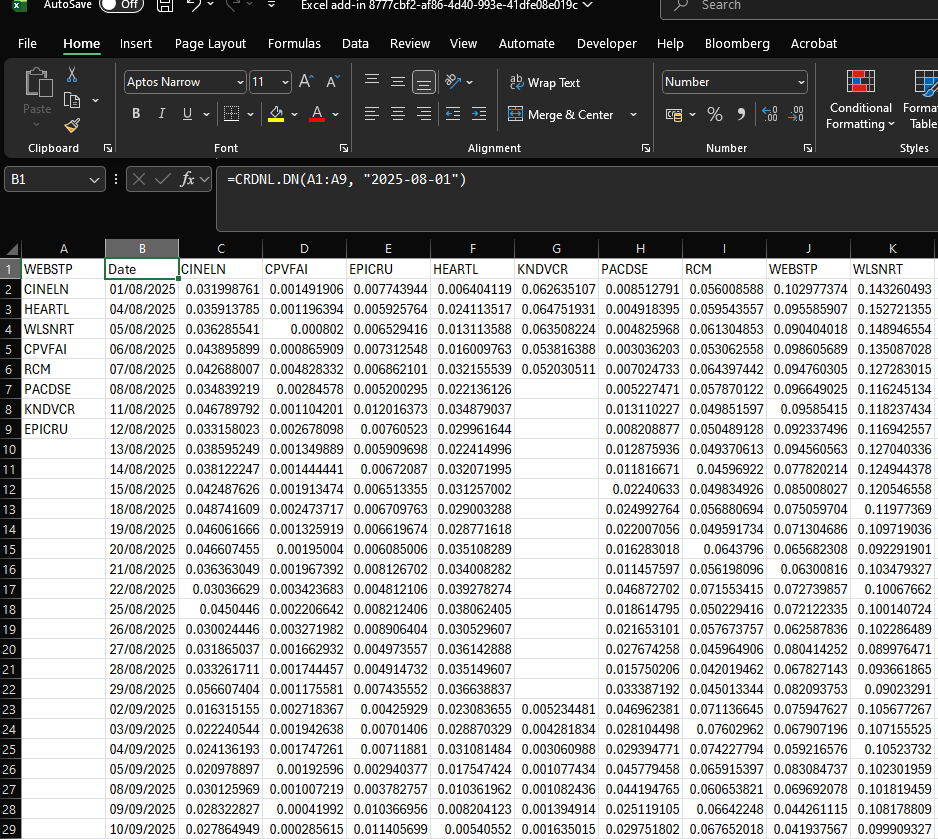
‹start_date›: The date, in the form of YYYY-MM-DD, for which to retrieve data.
‹model›: The model parameter is optional and defaults to “dn”.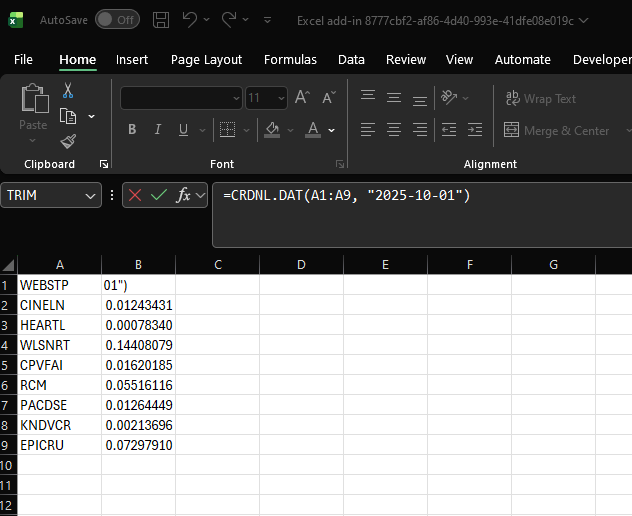
‹model›: the model for which to fetch data, currently dn is the only accepted and default value.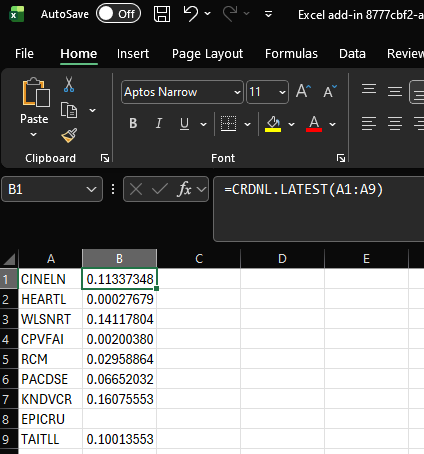
Help!
Function is returning #NA
There are two primary reasons for this to occur; firstly, the API key has not been set correctly, in which case try setting it again and retrying the function. Secondly, there is a symbology mismatch, in which case ensure the function is using the primary equity listing. If the error persists, contact engineering for further assistance.
Performace considerations
If the API is slow or unresponsive considering batching requests where possible, by using a cell range in the function, rather than creating multiple functions.Please note that the maximum number of symbols in one request is 1000.
Further help required!
Please contact engineering.